amibroker

HomeKnowledge Base

Limit number of trades per day in a backtest

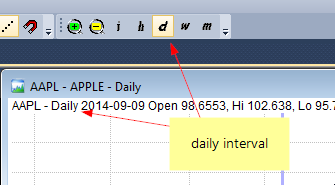
NOTE: The codes presented below are for intraday data only.

The scenario is as follows: we are intraday traders and we want to limit the number of trades made per day per symbol.

To simulate such scenario in a backtest, we need to count the signals and remove them accordingly after we reach our limit. There are several methods to do so and the choice depends on the signals that our system generates.

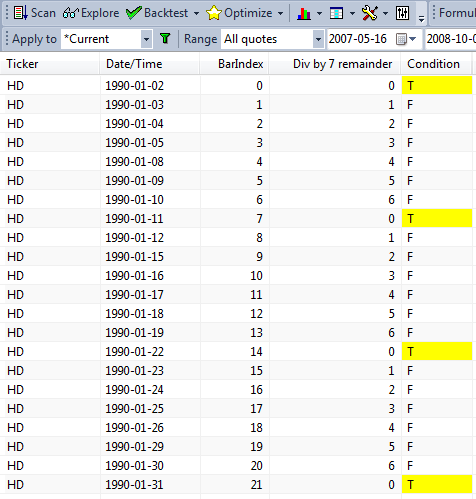
If our trading signals come in a sequence like Buy-Sell-Buy-Sell (without repeated signals in between), then we could just count BUY signals since the beginning of the day and allow first N of these signals, where N is the number of trades we allow. This can be achieved with Sum function:

// trades limit
2;

PlotClose"Close"colorDefaultstyleBar );

// identify new day
dn DateNum();
newDay dn != Refdn,-1);

// buy and sell signals
Buy CrossMACD(), Signal() );
Sell CrossSignal(), MACD() );

// visualize signals with yellow arrows
PlotShapes(Buy*shapeUpArrowcolorYellow0Low);
PlotShapes(Sell*shapeDownArrowcolorYellow0High);

// modify Buy array and allow only first N signals
Buy Buy AND SumBuyBarsSincenewDay) +) <= N;

// visualize modified signals with green triangles
PlotShapes(Buy*shapeUpTrianglecolorGreen0Low, -24)

Price chart

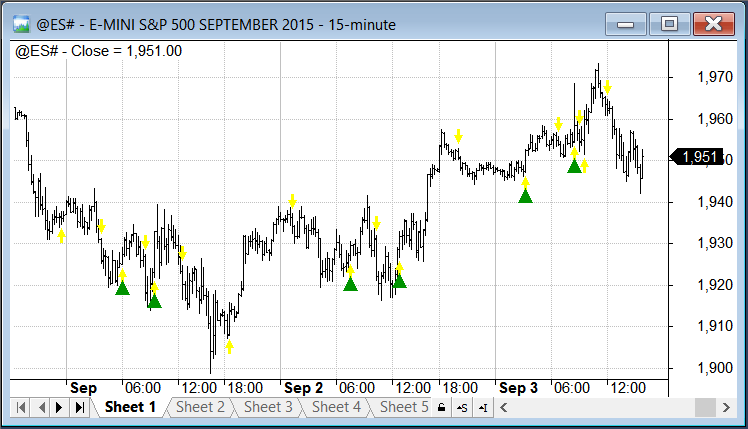
If the signals of the same type may get repeated and occur for example in sequence like Buy-Buy-Buy-Sell, then before counting the entry signals we would first need to remove redundant ones. This can be achieved with Equity( 1 ) function call, which will remove repeated signals the way backtester would handle them:

// trades limit
2;

PlotClose"Close"colorDefaultstyleBar );

// identify new day
dn DateNum();
newDay dn != Refdn, -);

// buy and sell signals
Buy =  MACD() > Signal(); // sample repeated signals
// exit on signal vs macd crossover or last bar of the day
Sell CrossSignal(), MACD() ) OR Refnewday); 

// visualize signals with yellow arrows
PlotShapesBuy*shapeUpArrowcolorYellow0Low );
PlotShapesSell*shapeDownArrowcolorred0High );

// remove redundant signals
Equity);

// modify Buy array and allow only first N signals
Buy Buy AND SumBuyBarsSincenewDay ) + ) <= N;

// visualize modified signals with green triangles
PlotShapesBuy*shapeUpTrianglecolorGreen0Low, -24 )

Price chart

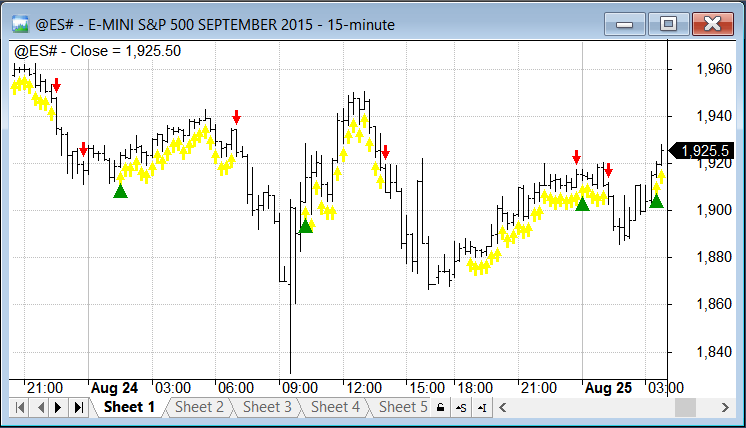
When our trading system uses complex trading rules so we don’t know the order of signals, we can use a loop to process signals and count trades.

// trades limit
2;

PlotClose"Close"colorDefaultstyleBar );

// identify new day
dn DateNum();
newDay dn != Refdn, -);

// buy and sell signals
// sample repeated signals
Buy =  MACD() > Signal();
//exit on signal vs macd crossover or last bar of the day
Sell CrossSignal(), MACD() ) OR Refnewday); 

// visualize signals with yellow arrows
PlotShapesBuy*shapeUpArrowcolorYellow0Low );
PlotShapesSell*shapeDownArrowcolorred0High );

tradeCount onBuy 0;

for( 
0BarCounti++ )
{
    
// reset trade counter on the new day
    
if( newDay] ) tradeCount 0;

    
// keep buy signal if there is no trade and trade count did not hit the limit
    
if( Buy] AND tradeCount AND NOT onBuy )
    {
        
OnBuy 1;
        
TradeCount++;
    }
    else
        
Buy] = 0// ignore other buy signals


if( onBuy AND Sell] )
    {
        
onBuy 0// reset onBuy flag on exit
    
}
}

// visualize modified signals with green triangles
PlotShapesBuy*shapeUpTrianglecolorGreen0Low, -24 )

How to manage overlapping entry/exit signals in portfolio test

When we run the portfolio-test and use default backtesting procedure – on each bar AmiBroker will first process exit signals, then use entry signals to open new trades.

There may be some strategies however, where this approach may not be enough. For example – if we simulate entries with limit price (so they occur somewhere in the middle of the day), but exits on Close – then if we do not use any margin loan, the funds from exit signals can only be used on subsequent days.

Since trading prices (BuyPrice, SellPrice, ShortPrice, CoverPrice arrays) don’t carry any timing information, but only the information about price level for given trade – then we need to delay release of funds by one day to get correct results. This can be done with the following command:

SetOption("SettlementDelay")

The unsettled cash is reported in the Detailed Log:

Detailed log

We need to remember that this option works on Days (not bars) and it may be better to use it with backtestRegularRaw instead of backtestRegular, otherwise some trades may not be entered because funds are not settled immediately – so we may need to be able to enter not on first but subsequent buy signals (all would really depend on the particular trading rules) – the behaviour of backtestRegular mode and processing raw signals is explained here: http://www.amibroker.com/guide/h_portfolio.html

Using Exclude statement to skip unwanted optimization steps

Sometimes when we optimize our system, we may want to use only a subset of all parameter permutations for our analysis and ignore the others that do not meet our requirements.

For example – if we test a simple trend-following strategy, where we enter long position when short MA crosses above long MA using code such as:

shortPeriods Optimize("Short MA"1011001);
longPeriods Optimize("long MA"5011001);

Buy CrossMACloseshortPeriods), MACloselongPeriods) );
Sell CrossMACloselongPeriods), MACloseshortPeriods) )

Then, shortPeriods parameter value should remain smaller than longPeriods, otherwise the trading rules would work against the main principle of the tested strategy.

There is an easy way to ignore the unwanted sets of parameters by using Exclude statement in our code. If the variable is true – the backtester will not calculate any statistics for that particular run:

shortPeriods Optimize("Short MA"1011001);
longPeriods Optimize("long MA"5011001);

Buy CrossMACloseshortPeriods), MACloselongPeriods) );
Sell CrossMACloselongPeriods), MACloseshortPeriods) );

Exclude shortPeriods >= longPeriods

The information from Info tab of Analysis window shows the difference between first execution (all 10000 backtest runs) and second one using Exclude statement. Note reduced number of steps and reduced optimization time.

Exclude results

How to add MAE / MFE dates to the backtest report

If we want to identify dates, when MAE and MFE levels have been reached during the trade lifetime – we can use the code example presented below.

The formula will process the trades one-by-one, read BarsInTrade property to know how many bars it took since trade entry till exit, then use HHVBars / LLVBars functions to identify how many bars have passed since lowest low or highest high within trade length.

With the information that highest or lowest value was observed N-bars ago – it will shift Date/Time array accordingly – so with use of Lookup() function pointing at the exitbar – we can read the date when HHV/LLV was observed within trade lifetime (BarsInTrade).

SetCustomBacktestProc"" );

function 
processTradetrade )
{
    
dt DateTime();

    
SetForeigntrade.Symbol );

    
llvDate LookupRefdt, - LLVBarsLowtrade.BarsInTrade ) ), trade.ExitDateTime );
    
hhvDate LookupRefdt, - HHVBarsHightrade.BarsInTrade ) ), trade.ExitDateTime );

    if ( 
trade.IsLong() )
    {
        
maeDate llvDate;
        
mfeDate hhvDate;
    }
    else
    {
        
maeDate hhvDate;
        
mfeDate llvDate;
    }

    
RestorePriceArrays();

    
trade.AddCustomMetric"MFE Date"DateTimeToStrmfeDate ) );
    
trade.AddCustomMetric"MAE Date"DateTimeToStrmaeDate ) );
}

if ( 
Status"action" ) == actionPortfolio )
{
    
bo GetBacktesterObject();

    
bo.Backtest); // run default backtest procedure

    
for ( trade bo.GetFirstTrade(); tradetrade bo.GetNextTrade() )
    {
      
processTradetrade );

    }

    for ( 
trade bo.GetFirstOpenPos(); tradetrade bo.GetNextOpenPos() )
    {
      
processTradetrade );
    }

    
bo.ListTrades();
}

Buy CrossMACD(), Signal() );
Sell CrossSignal(), MACD() )

How to use custom backtest metric as an optimization target

In Optimization and Walk Forward testing AmiBroker allows us to choose the optimization target that determines optimum values of optimized parameters. This can be done in Analysis->Settings->Walk Forward tab and the drop down list contains a list of built-in statistics to choose from:

Walk forward settings

However, we are not limited to built-in metrics only. Custom Backtester Interface allows us to add any custom statistics to the backtest/optimization reports and we can use these metrics for optimization too.

To do that, we first need to add a custom metric (this article explains how to do it: http://www.amibroker.com/guide/a_custommetrics.html). Then – we need to type-in our metric name into the Optimization Target box:

Walk forward settings - custom metric

The name we enter must be an exact match of the metric name we have defined in AddCustomMetric() method. If entered name can not be found in the Optimization result table, then Net Profit will be used instead.

Why Analysis results and Chart output may differ

In general AFL functions return identical results when the input data and settings are the same, no matter if they are called from the chart formula or from Analysis window.

Therefore, when we observe differences in results obtained in the chart vs results in Analysis window out of the same code, we should check the following settings to make sure we indeed provide identical input to our formula.

First thing to check is the data interval used in the chart and in Analysis window – it needs to be identical

Chart:
Chart periodicity

Analysis:
Analysis periodicity

Second thing to check, is that if we use Param() function in the code – we need to remember that parameters are separate for Analysis window (Analysis module has ChartID equal to 0). Therefore – it is necessary to keep the parameter settings in sync:

Parameters in Analysis window

Third thing to check is the Pad and align data to reference symbol option that may affect input data for Analysis window calculations if there are differences in quotes or timestamps between the analysed ticker and the reference symbol, so unchecking this option may be required:

Pad And Align in Analysis window

Last thing, is that if we calculate our indicators recursively in loops or use functions such as Cum() where results may depend on the number of loaded bars, then we also need to verify if e.g. chart zoom range makes any difference for our results in the chart.

AmiBroker uses its QuickAFL feature to optimize loaded data-range for best performance, however if our code is sensitive to a number of loaded bars, we may need to e.g. force loading certain number of historical bars with SetBarsRequired() function.

More information about QuickAFL can be found in the following KB article:
http://www.amibroker.com/kb/2008/07/03/quickafl/

Detecting N-th occurrence of a condition using modulus operator

Modulus (%) is an operator that returns the reminder from integer division. It is very helpful to create counters that wrap-around at user-specified N.

In order to define a condition, which returns True every Nth bar, the easiest way is just to use % (modulus) operator. If we apply modulus to consecutive numbers such as BarIndex() – then calculating the reminder from integer division of barindex by N will return 0 every Nth bar (on bars that are divisible by N). We can use the following exploration to demonstrate that:

7;
bi BarIndex();
condition bi == 0;

Filter 1;
AddColumnbi"BarIndex");
AddColumnbi "Div by 7 remainder ");
AddColumnIIFcondition'T''F' ), "Condition",
           
formatCharcolorDefaultIIfconditioncolorYellowcolorDefault ) )

Modulus 1

Since the remainder from division by 7 will equal zero only for the multiples of 7, then we will have our condition True every 7th bar (as marked in the above exploration results with T letter on yellow background).

Using the same technique we can also count occurrences of certain criteria and then apply the % operator. For example – let us say we want to test a rotational strategy, where we rotate our portfolio every 2nd Monday. To detect such condition in our code we need to first identify all Monday bars, then count them and use % operator to divide such count by 2.

The following exploration shows the calculations of the condition we look for:

Filter 1;
AddColumnDayOfWeek(), "Day of week");
AddColumnMon"Monday");
AddColumncountMon"Monday counter");
AddColumncountMon == 0"division by 2 remainder");
AddColumnrotation"condition"1colorDefaultIIfrotationcolorYellowcolorDefault) )

Modulus 2

Here is the formula showing how to code these technique for the rotational back-test:

SetBacktestModebacktestRotational );
posScore 100 RSI(); // sample scoring indicator
SetPositionSize10spsShares ); // sample position sizing

Mon DayOfWeek() == 1// identify Mondays
countMon CumMon ); // count Mondays

// rotate only on Monday, every 2nd one
rotation Mon AND (countMon == );
PositionScore IIfrotationposScorescoreNoRotate )

How to display interest gains in the backtest report

The default backtest report shows total Net Profit figure, which includes both trading profits and interest earnings. With Custom Backtest procedure we can easily isolate these components by summing up profits and loses from individual trades, then subtracting trading gains from the Net Profit and report them as separate metrics.

SetCustomBacktestProc"" );

if ( 
Status"action" ) == actionPortfolio )
{
    
bo GetBacktesterObject();
    
bo.Backtest(); // run default backtest procedure

    // read Net Profit, Winners and Losers profits from the report
    
st bo.GetPerformanceStats);
    
netProfit st.GetValue"NetProfit" );
    
tradeProfits st.GetValue("WinnersTotalProfit") + st.GetValue("LosersTotalLoss");

    
bo.AddCustomMetric"Trading profits"tradeProfits );
    
bo.AddCustomMetric"Interest earnings"netProfit tradeProfits );

}

// trading rules here
Buy CrossMACD(), Signal() );
Sell CrossSignal(), MACD() )

After backtest is run, we can see our custom metrics in the backtest report.

More information about creating custom metrics can be found in the manual:
http://www.amibroker.com/guide/a_custommetrics.html

Using optimum parameter values in backtesting

After Optimization process has found optimum values for parameters of our trading system, typically we want to use optimum values in subsequent backtesting or explorations. In order to achieve that, we need to manually update default_val (second) argument of Optimize function with the values obtained from the optimization report.

The arguments of Optimize function are shown below (note second parameter marked in dark red color – this is the default value parameter we will be changing after optimization run):

some_var = Optimize( "description", default_val, min_val , max_val, step );

Let us consider the following example formula used for optimization process:

SetOption("ExtraColumnsLocation"1);
periods Optimize"Periods"2550); // note that default value is 2
Level Optimize"Level"22150); // note that default value is 2

Buy CrossCCIperiods ), -Level );
Sell CrossLevelCCIperiods ) )

If we perform Optimization process and check the results (for this example we use Net Profit as the optimization target), we can see that the best results use Periods = 6 and Level = 126.

Optimization result

Now in order to run backtest and obtain exactly the same results as in the respective line of the above Optimization results, we need to enter the values into default argument, so the modified code will look like this:

SetOption("ExtraColumnsLocation"1);
periods Optimize"Periods"6550); // we changed default value to 6
Level Optimize"Level"1262150); // we changed default value to 126

Buy CrossCCIperiods ), -Level );
Sell CrossLevelCCIperiods ) )

Now we can use the code with modes other than Optimization and the formula will use optimized values we retrieved from the results.

Using multiple watchlists as a filter in the Analysis

The Filter window in the Analysis screen allows us to define a filter for symbols according to category assignments, for example watchlist members (or a result of mutliple criteria search).

The filter allows us to select one watch list for “inclusion” and one for “exclusion”. To include members of more than one watchlist, we can not simply pick them both in the Filter window – we need to combine these symbols together in another dedicated watchlist storing symbols from both lists.

Let us say we want to run a test on members of List 1 and List 2. To combine these watchlists together we need to follow the instructions below.

  1. Click on List 1, then in the bottom part of the Symbols window mark all tickers. A multiple selection is done by clicking on first and last item in the list while holding down the Shift key. We may also select all symbols by clicking on any symbol and pressing Ctrl+A key.

    Select symbols from watch list

  2. Now click on the selection with right mouse button and choose Watch list->Add selected symbol(s)

    Add symbols to watch list

  3. Pick an empty watchlist that we will use to combine our tickers (e.g. List 5 ) and confirm to add multiple symbols:

    Confirm adding multiple symbols

  4. Repeat the above steps 1-3 with List 2 members
  5. Now we can pick List 5 in the Filter window and run the test on all the tickers

    Create new watch list

An alternative solution to this is to filter out unwanted symbols in the code. In this case AmiBroker would need to run analysis for all tickers (so Apply to would need to be set to All symbols) and apply filtering while executing your formula. To do so you may use code like this for backtesting (filtering Buy signals):

Buy /* your regular trading rules here */;

watchlistCheck InWatchList) OR InWatchList);
Buy watchlistCheck  AND Buy// combine watch list filter with your rule

or code like this in exploration (adding extra condition to Filter variable):

Filter /* your regular exploration filter here */;
watchlistCheck InWatchList) OR InWatchList);
Filter watchlistCheck AND Filter// combine watch list filter with your rule

Please keep in mind that filtering in the code is significantly slower. Using this method AmiBroker needs to read the data for all tickers, prepare arrays, then evaluate the formula and verify the condition – so using Filter window and the first approach will be faster, as the filtering is done before the formula execution, saving lots of time required for data retrieval and AFL execution.

« Previous PageNext Page »