amibroker

HomeKnowledge Base

How to backfill all symbols in RT database

Various data sources have different backfill capabilities, therefore the procedure to backfill all symbols varies. There are three categories of data sources, those that offer:

  1. unlimited backfills (eSignal, IQFeed),
  2. limited, 1-symbol at a time backfill (Interactive Brokers),
  3. no backfill at all (for example DDE)

As a general rule, all real-time data sources provide backfills on-demand, which means that backfill for each symbol has to be requested separately. If data source provides backfill and there are missing quotes in the database, AmiBroker will automatically request backfill on first access to given symbol. So, as soon as you display its chart fresh data will be requested and backfilled. Backfill is not immediate, because it is Internet-based process that involves request-response procedure, so data are requested from external server and arrive in a few seconds or so.
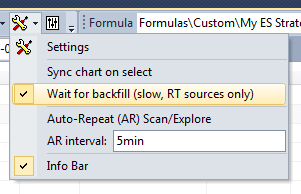
The same procedure is performed when doing any access including running Analysis, so backfill is requested as soon as given symbol is accessed, but by default Analysis window will not wait until backfill data arrive unless you turn on the Wait for backfill option (provided that data source supports it).

Wait for backfill option

It is worth to note that not all data sources support this feature. It needs to be handled by the data plugin, and many 3rd party plugins do not offer this.

If you are using eSignal or IQFeed or other data source with automatic, unlimited backfill you can use procedure described in How to use Real-Time data sources tutorial.

If you are using Interactive Brokers then the procedure is differnet since Interactive Brokers puts lots of limitations on backfills. To learn how to backfill all symbols using Interactive Brokers please read this dedicated tutorial on IB.

If you are using data source that does not offer any backfill, the only option is to use ASCII import to import the historical data from text files.

Do NOT make assumptions on number of bars

From time to time some users face “Error 10. Subscript out of range” in their formulas. The error itself is described in the manual, but still a few words of explanation why it happens may be useful.

The error usually occurs when formula uses hard-coded number of bars in the loop statements like this:

for( 0300i++ ) // MISTAKE: FIXED number of bars
{
  
Close]; // ERROR 10. because 'i' becomes greater than BarCount

or like this:

for( BarCount 1BarCount 300i-- ) // MISTAKE: FIXED number of bars
{
  
Close]; // ERROR 10. because 'i' becomes LESS than zero

In both cases the code will FAIL if it is run on symbol that has LESS than 300 bars (BarCount < 300). In fact it will even fail on symbol that has more than 300 bars because of two facts:

  1. during AFL Editor’s Verify Syntax not more than 200 most recent bars are used
  2. a chart may be zoomed in so number of visible bars may be much lower and QuickAFL kicks in (so your AFL is executed with visible bars only).

This all means that one should never make any assumptions on number of bars your formula would get, because if you do, the formula will fail.

The formula should be written so it is able to execute without errors with BarCount as small as 1 (ONE).

This is normally done by writing a ‘for’ loop in a way recommended in the manual:

for( 0BarCounti++ )
{
   
Close]; // this will never produce Error 10 because i is in the range 0..BarCount-1

If your formula references past data, say 10-bars earlier, you should start your loop with index 10, as below:

for( 10BarCounti++ )
{
  
x] = Close] - Close10 ]; // both subscripts will be OK

What to do if your formula, for some reason, really requires fixed number of bars? Well, the answer is that you should check if you really get as many bars as you think:

if( BarCount 300 // check first if you have enough bars
{
   
// here we know that we have more than 300 bars
   
for( 0300i++ )
   {
      
Close]; 
   }

A function with multiple return values

A typical AFL function returns one value. For example sin( x ) returns sine value of argument x. Sometimes however it is useful and/or required to return more than one value from the function.

Returning multiple values is possible only via arguments passed by reference, but trouble is that in AFL all arguments are passed by value (as in C language). Passing by value means that only value of variable is passed, not the variable itself, so original variable is not modified as shown in the example below:

function Dummy)
{
    
7// x is treated as function-local
}
//
val 10;
Dummyval );
printf"%g\\n"val ); // will print 10 because 'val' is unaffected by function cal

The behaviour shown above is desirable because we usually want the function to be opaque and do not interfere with what is defined outside of the function except for returning the result of the function.

But what if we actually wanted to write to variables passed as arguments? Well that is possible if we pass the names of the variables as arguments.

// This example shows how to return multiple values
// the idea is to pass the name of the variable instead of
// value
//
function fun_multiple_resultsresult1nameresult2name )
{
  
VarSetresult1name); // setting variable using passed name
  
VarSetresult2name);
  return;
}
//
// to get multiple values from a function
// we call the function passing NAMES of variables
//
10;
20;
printf("a = %g\\n");
printf("b = %g\\n");
//
fun_multiple_results"a""b" ); // pass the names of variables
//
printf("a = %g\\n"); // see new values assigned to variables
printf("b = %g\\n")

Of course we can use arguments passed by name for two-way communication – we can use them as both inputs and outputs as shown in the following example that swaps the values of arguments

function Swapvar1namevar2name )
{
    
temp1 VarGetvar1name ); // read the value from variable
    
temp2 VarGetvar2name );
    
VarSetvar1nametemp2 ); // write the value to variable
    
VarSetvar2nametemp1 );
}
// Initial values
5;
37;
//
printf("Before swap x = %g, y = %g\\n"x);
//
Swap"x""y" ); // pass names of variables
//
printf("After swap x = %g, y = %g\\n"x)

The code above will produce output like this:

Before swap x = 5, y = 37
After swap x = 37, y = 5

So it is clear that variables were passed to the function, swapped and returned successfully.

Broad market timing in system formulas

Some trading systems may benefit from attempt to time the broad market. A market-wide valuation, such as moving average, sentiment or some other mechanism may be used to tell if we should be in the market or not.

Flexibility of AFL language allows to create rules or indicators, which are based on more than just one symbol. This enables us to introduce additional filters based on wide-market index performance.

For the purpose of reading quotes of another symbol one can use Foreign or SetForeign functions.

The following formula shows how to generate entry signals in individual stocks when S&P500 index is above its 200-period moving average and exit signals when S&P500 is equal or below 200-period average (^GSPC is a ticker for Yahoo Finance data for S&P500)

//
// read S&P 500 values from ^GSPC ticker
//
sp500 Foreign"^GSPC""C" );
//
// market-wide filter should be in "state" form
// (so it is True all the time when market is up)
//
marketup sp500 MAsp500200 );
marketdown NOT marketup;
//
// sample trading rules (MACD crossovers)
//
BuySignal CrossMACD(), Signal() );
SellSignal CrossSignal(), MACD() );
//
// combine per-symbo signals with broad-market timing
//
Buy BuySignal AND marketup// enter trade only when buy signal AND market is in up trend
Sell SellSignal OR marketdown// exit position if sell signal OR market turns dow

A more complex broad-market timing that requires not only closing price of market index can be implemented using SetForeign function. SetForeign replaces all OHLCV data series with that of the “other” security and allows to calculate all kind of indicators that would normally use current security. Broad market timing does not need to be just “all-in” or “all-out” switch. For example one can switch the trading method depending on whenever broad market is trending or sideways.

//
// Switch to S&P symbol to calculate broad-market timing
//
SetForeign"^GSPC" );
//
// now we can calculate any indicator based on SP500
//
MarketIsTrending ADX40 ) > 20// ADX (40 days) from SP500
//
// now go back to original data (current symbol)
//
RestorePriceArrays();
//
// you can have different rules that are switched
// depending on what broad market is doing
//
TrendingBuy CrossCMAC30 ) );
TrendingSell CrossMAC30 ), );
//
SidewaysBuy CrossMACD(), Signal() );
SidewaysSell CrossSignal(), MACD() );
//
// switch methods using broad-market timing
//
Buy IIfMarketIsTrendingTrendingBuySidewaysBuy );
Sell IIfMarketIsTrendingTrendingSellSidewaysSell )

In this simple example we assume that market timing signals change very infrequently so they change much less often than Trending/Sideways Buy/Sell signals are generated. If that is not the case the switching logic would need to be more complex to decide what to do when we are in the “trending” trade and market switches to sideways mode. In such situation, the code above uses SidewaysSell signal to sell the position, which may or may not be what you are after.

Another example is changing position sizing depending on broad market conditions. We can choose to be fully invested when broead market is up and only 30% invested in down market.

//
// Switch to S&P symbol to calculate broad-market timing
//
SetForeign"^GSPC" );
//
// now we can calculate any indicator based on
// SP500
//
MarketIsUp MAC200 ); // here C represents closing price of SP500
//
// now go back to origiginal data (current symbol)
//
RestorePriceArrays();
//
// normal rules (in this example they do not chang)
//
Buy CrossMACD(), Signal() );
Sell CrossSignal(), MACD() );
//
// no more than 10 positions open at a time
//
SetOption("MaxOpenPositions"10 );
//
// change position sizing depending on broad market conditions
// in this example we will allocate:
// 10% per position
// if broad market is up (so we can be allocated upto 100% of funds)
// 3% per position
// if broad market is down (so we can be allocated upto 30% of funds)
//
SetPositionSizeIIfMarketIsUp10), spsPercentOfEquity )

How to display Range Bars

The Range Bars are price-driven bars, with each bar having a required minimum high-low range. Source data are consolidated into one bar until the range requirement is reached, then a new bar is started.

AmiBroker fully supports range-bar type of charting and the bar size is based on the TickSize of given symbol. This allows to define symbol-specific tick sizes individually, them display a chart which for example shows 10R bars (meaning bars using a range of 10-ticks for each symbol respectively).

To display range charts, first you need to specify the TickSize in the Symbol–>Information window.

Information window

This can be done manually as shown above, however in case of larger group of symbols it is also possible to use ASCII Importer for this purpose (more details about ASCII imports can be found here: http://www.amibroker.com/guide/d_ascii.html).

Once TickSize has been defined, then in order to display chosen range chart, the easiest way is to use Interval box in the toolbar and just type-in the desired bar size. For example, to select the range bar of 10-ticks, one can type-in 10R in the toolbar:

Range bar selection

Custom range intervals can also be defined in Tools–>Preferences, Intraday tab:

Preferences window

Then the pre-defined interval can be selected from View->Intraday menu.

It is worth noting that for best results, your database should use Tick as Base Time Interval, as then each trade is represented by an individual record in the database and can be consistently compressed to range bars. Using higher-interval data (such as 1-minute) may produce bars that are not perfect, especially if 1-minute bar high-low difference is comparable with selected range.

How to print result list from Analysis window

As far as backtest results are considered, they can be printed directly from Report Viewer.

Report printing

But sometimes we may want to print just the result list of scan, exploration or optimization. In order to print out the results list from Analysis window it is necessary to store the results list into a file first. This can be achieved by using File->Export HTML/CSV option from the main menu of the program (Export option is available when Analysis window is open):

Export

I recommend saving in HTML format as only then color output will be preserved.

Export as HTML

Once the result list is saved to a HTML file, you can double click on the file to open it with your default web browser. From web browser you can choose Print option.

If you prefer to modify the file prior to printing you can also save the result list in CSV format that can be open with Excel or any other application of your choice.

An alternative solution is to use system clipboard and to copy the results (using Ctrl+C keyboard shortcut or Copy option from the context menu available under right-mouse button), paste to the application like MS Excel for example and printing the results there.

How to display Bond and Bill prices in fractions

Treasury Bond and Bill futures are traded in fractions, not decimals. A typical bond quote may be 124’21 which means 124 and 21/32nds, so one needs special method to display prices in non-decimal format.

To achieve desired result we need to do two things.

1. Switch Y axis grid to desired fraction format. To make a change, right click on the chart and select Parameters, then switch to Axes & Grid tab and change Grid Format as shown below:

Parameter Window

2. Create a price chart with custom title showing fractions instead of decimals. Go to Analysis->Formula Editor, enter the following formula and press Apply Indicator toolbar button.

function NumToFracnum )
{
  return 
StrFormat("%.0f'%0.f"floornum ), fracnum ) * 320 );
}
PlotClose"Close"colorDefaultstyleCandle);
Title "{{NAME}} - {{INTERVAL}} {{DATE}} Close: " NumToFracClose )

The NumToFrac function formats decimal value into full points and 1/320nds fraction of the full point.

Too small / unreadable Profit Table in the backtest report

Some of users may observe that their Profit table is too small, so the numbers get truncated or the text is too small.

First let me tell you that profit table in the backtest report is not really a table, but a bitmap image with fixed dimensions. Profit table, like any other user-definable report chart, is created by running an AFL formula present in the “Report charts” subfolder. The chart is rendered into bitmap image that gets later embedded in the backtest report.

The size of backtest report images depends on Analysis window settings. In order to increase the size of generated images, it is necessary to go to Analysis -> Settings, Report tab and increase the picture dimensions:

reportchartdim

Once you change it, newly generated reports will use enlarged image dimensions. Adjusted settings will affect new backtests only, but not the old reports that have already been generated.

Tip: You can create your own report charts by placing your own AFL formula in the “Report charts” subfolder.

« Previous Page