January 22, 2016
How to fill background between hand-drawn trend lines
Among built-in drawing tools, the Triangle, Rectangle and Ellipse allow to fill the background with custom color. However, if we wanted to fill the space between manually drawn trend lines, then we could use AFL formula with Study function that allows to detect the position of the line. Then – knowing the arrays of top and bottom lines we could fill the area between with a cloud plot.
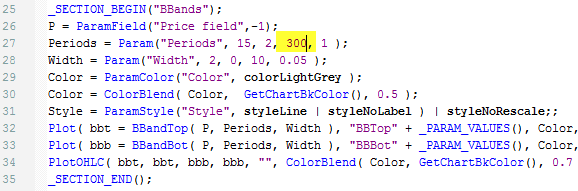
A sample formula, which shows such implementation is presented below. The code fills the space between L1 and L2 trendlines (red color) and between upper and lower bands of the regression channel (RU and RL study id’s respectively).
// regular price plot
Plot( Close, "Close", colorDefault, styleBar );
// custom function definition
function FillSpace( ID1, ID2, color )
{
// get current chart ID
chartID = GetChartID();
// read the positions of the lines
l1 = Study(ID1, chartID );
l2 = Study(ID2, chartID );
// draw cloud chart
PlotOHLC( l1, l1, l2, l2, "", ColorBlend(color, GetChartBkColor() ), styleCloud|styleNoRescale|styleNoLabel, Null, Null, 0, -1 );
}
// call function and refer to the assigned study ID's
FillSpace( "L1","L2", colorRed );
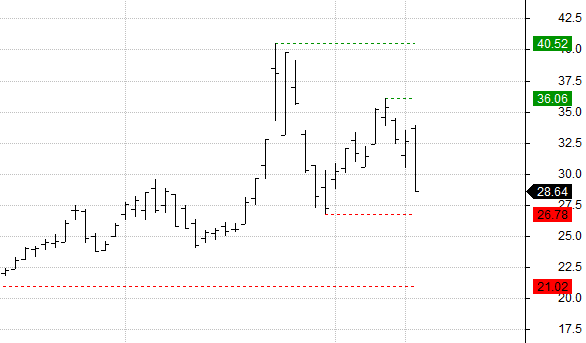
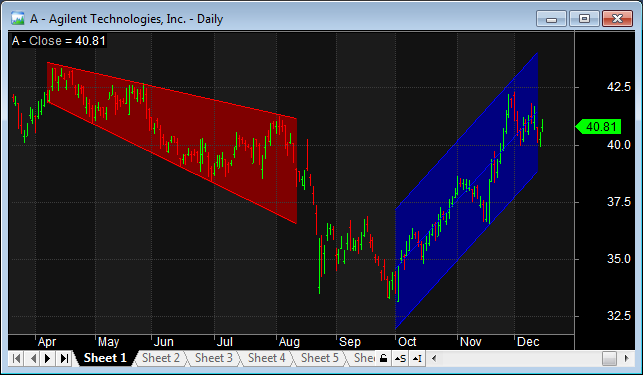
FillSpace( "RU","RL", colorBlue )The chart produced by the formula looks as follows:
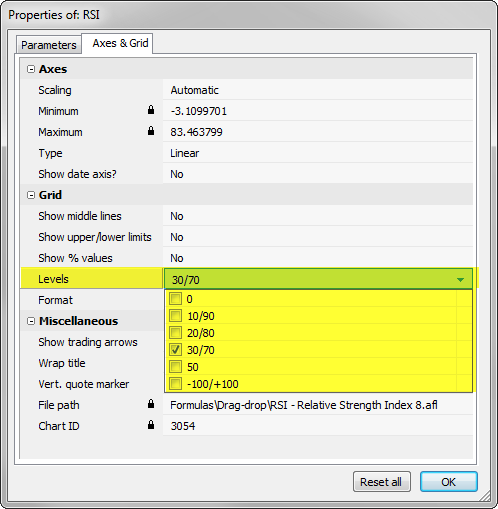
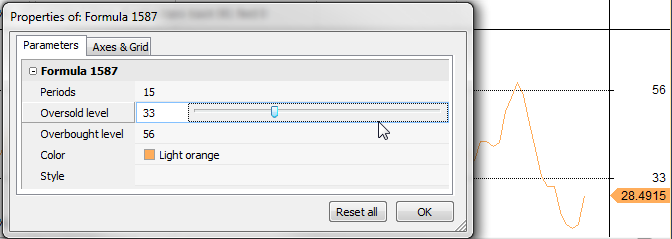
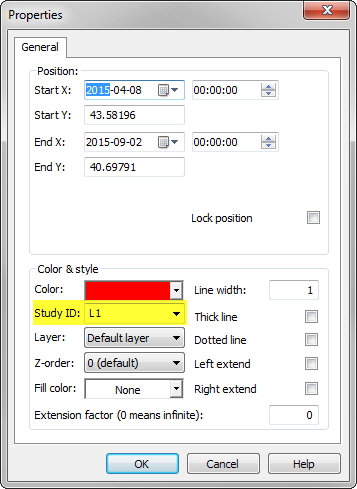
We need to remember that each line needs to have unique Study ID assigned in the Properties window.
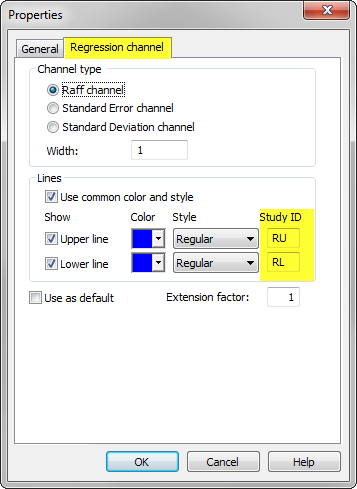
In case of regression channel the ID’s of the upper and lower lines are defined in Regression Channel tab:
If we wanted to handle more lines, then it may be more practical to process the list of study ID’s defined in a custom string instead of individual function calls.
// regular price plot
Plot( Close, "Close", colorDefault, styleBar );

// custom function definition
function FillSpace( ID1, ID2, color )
{
   // get current chart ID
   chartID = GetChartID();

   // read the positions of the lines
   l1 = Study(ID1, chartID );
   l2 = Study(ID2, chartID );

   // draw cloud chart
   PlotOHLC( l1, l1, l2, l2, "", ColorBlend(color, GetChartBkColor() ), styleCloud|styleNoRescale|styleNoLabel, Null, Null, 0, -1 );
}

function BulkFill( IDlist, color )
{
    for( i = 0; ( ID1 = StrExtract( IDlist, i ) ) != ""; i += 2 )
    {
      ID2 = StrExtract( IDlist, i+1 );
      FillSpace( ID1,ID2, color );
    }
}

// call function and refer to the assigned study ID's
BulkFill( "L1,L2,RU,RL,R1,R2", colorRed )
 Filed by Tomasz Janeczko at 2:56 pm under Charting
Comments Off on How to fill background between hand-drawn trend lines