January 16, 2016
Automatic support and resistance lines based on last HHV and LLV value
In this example we will present a method to plot automatic support and resistance lines based on recently hit highs/lows. In order to draw horizontal lines showing levels of recent HHV/LLV values and start drawing at the point of the chart, which defines given price level – we first need to identify the bar, where the line should start. This can be done with use of HHVBars / LLVBars functions.
These functions allow to find out the number of bars that have passed since our support or resistance level was established, so we could prevent from drawing the lines before these points.
This example shows how to draw support and resistance lines based on HHV/LLV levels:
// define reusable function
function SupResLevels( bars, colorUp, ColorDn )
{
bi = BarIndex();
lvbi = LastValue( bi );
// return HHV value only for bars starting from the bar where HHV level was established
hv = IIf( bi >= lvbi - LastValue( HHVBars( High, bars ) ), LastValue( HHV( High, bars ) ), Null );
// the same approach for LLV
lv = IIf( bi >= lvbi - LastValue( LLVBars( Low, bars ) ), LastValue( LLV( Low, bars ) ), Null );
// plot levels
Plot( hv, "hv", colorUp, styleDashed );
Plot( lv, "lv", ColorDn, styleDashed );
}
// price plot
Plot( Close, "Close", colorDefault, styleBar );
// call function with various parameters
SupResLevels( 10, colorGreen, colorRed );
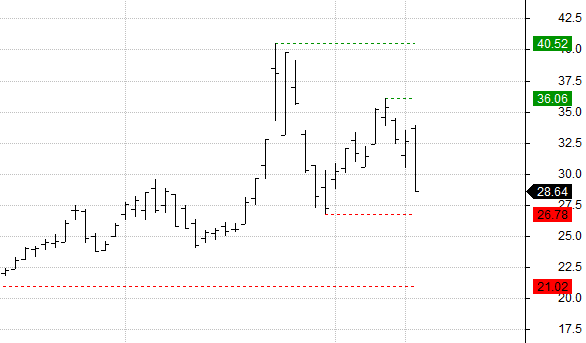
SupResLevels( 50, colorGreen, colorRed )The chart below shows the output produced by the formula:
 Filed by Tomasz Janeczko at 12:06 am under Charting
Comments Off on Automatic support and resistance lines based on last HHV and LLV value