January 17, 2016
Adding custom grid levels to RSI indicator
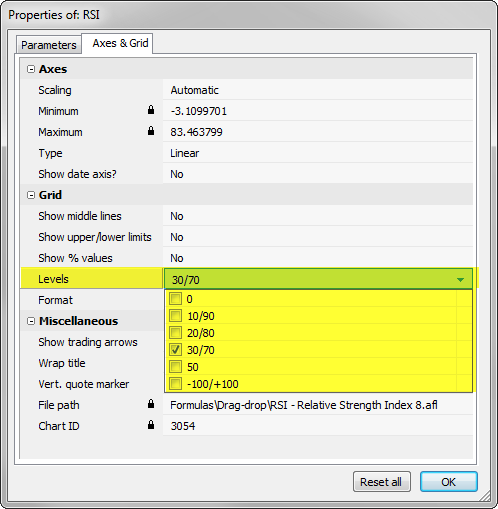
Built-in RSI indicator offers the ability to display one of predefined grid levels to indicate oversold and overbought regions. This can be done in Axes&Grid tab of Parameters window available under right-mouse button.
If we require more flexibility, then as an alternative, we could modify the code and call PlotGrid function to display the custom grid lines. This allows to specify any level for the grids. A modified formula is presented below:
SetChartOptions( 0, chartShowArrows, 0 );
periods = Param( "Periods", 15, 1, 200, 1 );
oversold = Param( "Oversold level", 15, 1, 100, 1 );
overbought = Param( "Overbought level", 85, 1, 100, 1 );

Plot( RSI( periods), _DEFAULT_NAME(), ParamColor( "Color", colorCycle ), ParamStyle("Style")  );
PlotGrid( oversold );
PlotGrid( overbought )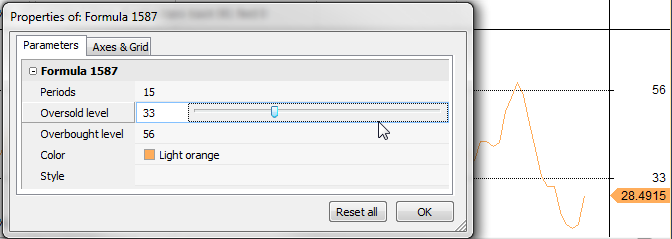
Now, since the formula uses Param function as input, the custom grid levels can be defined and modified in Parameters tab.
 Filed by Tomasz Janeczko at 12:01 am under Indicators
Comments Off on Adding custom grid levels to RSI indicator