amibroker

HomeKnowledge Base

How to sync a chart with the Analysis window

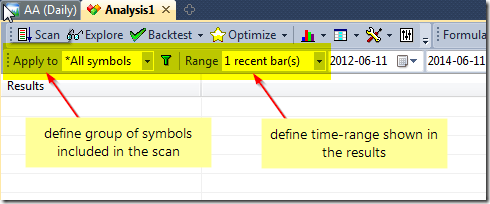
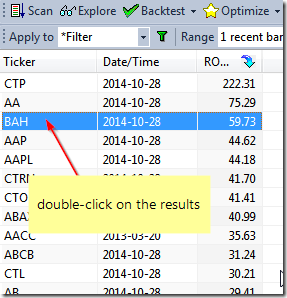
When we want to sync a chart with the selected symbol in the Analysis results list, it is enough just to double-click on the particular line in the list and AmiBroker will automatically switch the selected symbol and interval to match the Analysis window.

Sync by double click

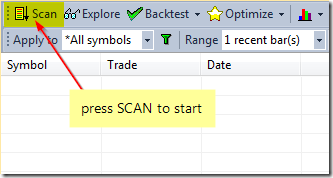
Additionally, when we browse through Scan or Backtest results, double-clicking would be an equivalent of Show arrows for all raw signals option from the context menu and would display trading arrows in the chart to match the signals generated by the formula.

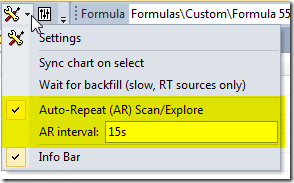
If we find that double-clicking is too much work, it is possible to mark Sync chart on select option in Analysis window settings menu:

Sync chart on select

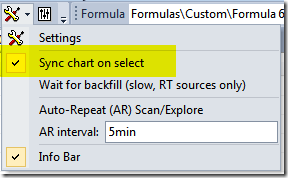
and then single click to select a chart is enough to sync the symbol in the chart. This also allows to use keyboard (up/down cursor keys) to change the selection and sync automatically.

When we have more than one chart window displayed, then Analysis window will always sync the last opened chart window.

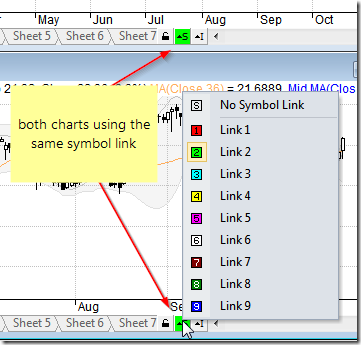
If we want to sync multiple chart windows we can use Symbol Link feature. Once multiple windows have the same “Symbol Link” color selected, browsing through the results list in Analysis automatically will automatically sync all linked chart windows (e.g. for the purpose of showing different intervals in each of the charts).

Linking

More information about chart link functionality is available in tutorials at:
http://www.amibroker.com/guide/h_sheets.html. See also video tutorial showing how to use symbol linking: http://www.amibroker.com/video/FloatAndLink.html

Using per-symbol parameter values in charts

Parameter values in AmiBroker are stored separately for each ChartID. A ChartID is a number that uniquely identifies chart. This makes it possible that parameters having same name can hold different values when they are used in different charts (different ChartIDs). This also allows to share parameters if two panes use same ChartID. (A detailed explanation can be found here: http://www.amibroker.com/kb/2014/10/06/relationship-between-chart-panes/ )

For this reason, if we want to have separate chart parameters for each symbol, we need to set up separate chart for every symbol. To do so, follow these steps:

  1. create several new chart windows using File->New->Blank Chart (or choosing New Blank Chart from the menu under + button in MDI tabs area)
    New Blank Chart

  2. drag Price( all in one) formula or any other indicators onto each of the newly opened windows
    Drag-drop chart

  3. select different active symbol for every chart
  4. define parameters individually and save the whole layout in the Layouts window

As a result – we have a setup of several chart windows, where we can quickly access given symbol showing chart with its separately stored parameters.

MDI Charts

There is also a way to handle the chart parameter values directly from the AFL formula, which would detect the active symbol and set the parameter values accordingly. Here is an example of such implementation using switch statement:
http://www.amibroker.com/guide/keyword/switch.html

To display this chart, open the Formula Editor, enter the following code and then press Apply Indicator button.

// detect the active symbol and store in n variable
Name();

// set parameter values based on the symbol name
switch ( )
{
// values for MSFT symbol
case "MSFT":
    
MA1periods 10;
    
MA2periods 21;
    break;

// values for IBM and NVDA
case "IBM":
case 
"NVDA":
    
MA1periods 30;
    
MA2periods 40;
    break;

// values for other tickers
default:
    
MA1periods 50;
    
MA2periods 100;
    break;
}

PlotClose"C"colorDefaultstyleBar );

PlotMACloseMA1periods ) , "MA(" MA1Periods ")" colorRed );
PlotMACloseMA2periods ) , "MA(" MA2Periods ")"colorBlue )

This way we can handle all individual parameter values within a single chart pane.

How to create toolbar button for custom interval

IMPORTANT NOTE: Before you add toolbar buttons for dozens of intervals please note that any interval can be picked from Interval Selector combo-box. If given interval is not present, you can just type it: 7m means 7-minute, 3h means 3-hour, 2D is 2-day), as shown below:

Custom time intervals

In order to add custom time-interval buttons onto the toolbar we first need to define our custom intervals in Tools->Preferences->Intraday:

Custom time intervals

Now, in order to customize the toolbar go to Tools-> Customize menu. That switches AmiBroker into special customization mode.

Now, while keeping the customize dialog open, we can just go to View->Intraday menu and pick the items we need, then start dragging it with the mouse cursor to the toolbar of our choice.

Custom time intervals

If we keep holding down CTRL key while dragging the items, a copy will be created on the toolbar, so the items will not be removed from the original menu.

Custom time intervals

It is also possible to replace the default text-description with a button image. This is further explained in the manual:
http://www.amibroker.com/guide/h_customizeui.html

How to force Line chart style for specific symbols (like mutual funds)

There is an easy way to avoid switching the price chart style back and forth if we want e.g. to display a candlestick chart for our stock symbols, but a line chart for just a subset of tickers in our database (e.g. mutual funds).

To achieve that – we need to set Continuous Quotations option to No in Symbol->Information window for the symbols that have only one price fixing per day (only close price available).

Continuous Quotations

Then – if we choose View->Price Chart Style to Auto – the chart will automatically use Line style for all symbols that have Continuous quotations option set to No. Other symbols will still use Candlesticks chart style.

Automatic style

How to customize list-view columns

A list-view is a view that displays a list of scrollable items in a table-like format. List-views are used in Real-Time quote window, Analysis window, Symbol list, etc. The columns in any list-view in AmiBroker can be customized in various ways to better match our needs and display the required statistics and readings the way we find it most useful. For the sake of example let us consider Analysis window result list.

Many of the customization actions can be performed directly on the column headers. It is possible to re-order the columns by dragging them with mouse cursor:

Column drag

and their width can be re-sized by dragging the divider lines between columns (double-clicking on that area will auto-resize the columns to match their contents).

Column resize

Hint: You can auto-resize all columns to their content at once by holding down Ctrl key and pressing + (plus sign) key on the numeric keypad.

For more operations it is possible to use Setup Columns… menu available from the context menu, which displays after right-clicking on the headers.

Column resize

Setup Columns dialog allows to re-order, hide/show selected columns.

Column setup

To hide a column uncheck the box, to show it back again, check the box. To re-arrange columns, select a column and click Move Up/Move Down buttons.

It is important to remember that the set of columns will depend on the last run mode, so it will be different for Scan, for the Backtest Trade List, for Summary type of report or Optimization.

Column setup 2

Further customization options are available programmatically. Custom Backtest interface allows to add your own metrics to the backtest report (more info: http://www.amibroker.com/guide/a_custommetrics.html)

We can also define in our code where those additional columns are positioned in the report (this includes both custom metrics added to the report or optimized parameter values in the Optimization). By default they would be listed at the very end, but SetOption() function allows to set different position, for example:

SetOption("ExtraColumnsLocation")

Relationship between chart panes

In order to explain possible relationships between chart panes in AmiBroker, let us first introduce two important attributes associated with each chart pane, these are Chart ID and File path.

To see these attributes, we need to right-click on the chart and choose Parameters, then Axes&Grid tab:

Parameters window

The File path defines physical AFL file on your hard-drive that contains the indicator code used to generate charts. The Chart ID is an index to AmiBroker’s internal chart table. The chart table holds chart settings such as those seen in Axes&Grid tab, including the File path. So knowing the Chart ID, AmiBroker knows everything about the chart. The Chart ID uniquely identifies the chart.

Chart ID plays important role in the following areas:

  1. Chart parameters are keyed by Chart ID so two different charts may have same names of parameters, yet parameters are independent if those charts have different ChartID.
  2. Hand-drawn studies are stored wih Chart ID assigned to it, so they “belong” to given chart and can be referenced from other formulas using Study() function
  3. Chart IDs are stored in the layout files so AmiBroker knows which charts should be loaded when layout is loaded.

When we compare two charts, then the following relations are possible:

  1. if both Chart IDs and File paths are different, then charts are completely independent. This will happen if we use Insert option from the Charts window to create a new chart pane or when we double-click on the given formula (double-click works as Insert), because AmiBroker then would create new Chart ID and independent copy of the formula as described in manual http://www.amibroker.com/guide/h_dragdrop.html

    Insert

  2. if Chart IDs are different in both chart panes but File Path is the same, then these are different charts, yet they share same formula file. In such case hand-drawn studies will not get transferred and parameters will not be shared, but drag&drop operations and changes in the formula will affect both charts. This situation will occur if we use Insert Linked option from the Charts window to create a new chart pane directly linked to the original formula.

    Insert linked

  3. if Chart ID is the same for both – then it is essentially the very same chart. It means that all the hand-drawn studies and parameters are common for both charts (changes in one chart pane will affect the other) and all the drag&drop operations or formula changes affect both charts – that is because as a result of dragging and dropping indicators the underlying code is being modified (new sections are added). Such relationship between chart panes will happen when we open another chart window that uses the same chart template as the previous window (e.g. using File->New->Default Chart) or save chart template and load it from the other window.

There is also a functionality in AmiBroker, which allows to copy-paste the selected chart pane and define which elements are pasted. To do that click on the pane you want to copy, choose Edit->Copy from the menu, then switch to the place where you want to paste it and choose Edit->Paste Special

Paste Special

Choosing first option creates new Chart ID, and creates a copy of formula, so resulted chart is independent from source chart. Choosing second option creates new Chart ID, but links it to same formula as original, so the formula is shared. Choosing third option inserts a pane that uses same Chart ID (identical chart, everything shared).

Paste Special window

How to setup automatic periodic scans & explorations

One of the most powerful features of AmiBroker is the ability of screening even hundreds of symbols in real-time and monitor the occurrence of trading signals, chart patterns and other market conditions we are looking for. This can be done in Analysis module with Scan or Exploration features.

The main difference between Scan and Exploration is that Exploration allows to customize the output shown in Analysis window (this is explained in details in the following tutorial chapter: http://www.amibroker.com/guide/h_exploration.html), while Scan performs search for at least one of Buy, Sell, Short, Cover signals and displays predefined set of columns. Both these features allow for continuous screening of the database in real-time conditions.

The following procedure shows how to configure basic scan formula and generate alerts when conditions coded in the formula are met. We assume that AmiBroker is already configured to receive real-time data from one of realtime data vendors – the list of recommended datasources is available here: http://www.amibroker.com/guide/h_quotes.html

We need to do the following:
– open Formula Editor window with Analysis->Formula Editor command from the menu
– in the editor window enter or paste the code below

// example trading signals defined here
Buy CrossMACD(), Signal() );
Sell CrossSignal(), MACD() );
//
// additional part of the formula which generates audio alerts when condition is detected
AlertIFBuy"SOUND C:\\Windows\\Media\\Ding.wav""Audio alert");
AlertIFSell"SOUND C:\\Windows\\Media\\Ding.wav""Audio alert")

After entering the code use Tools->Send to Analysis as shown below:

Send to Analysis

Then in the Analysis window select Apply To: All Symbols, Range: 1 Recent bar, this defines which symbols are included in the screening and what time-range will be shown in the results list.

Range setting

To enable continuous screening, mark Auto-repeat (AR) Scan/Explore option and enter the repeat interval. The interval can be specified in minutes or seconds (for example entering 10s means 10-seconds, while 5m means 5-minutes). The below example uses 15-second repeat interval:

Auto-repeat setting

NOTE: If that is the very first screening after launching the database and it may require filling the historical quotes, then it is also required to mark Wait for Backfill (applies to data sources, which support this feature, see: http://www.amibroker.com/guide/h_rtsource.html for more details).

Now press Scan button to initiate the screening process:

Scan

The results window will show the hits and generated alerts will also be logged in Alert Output window and the scan will be automatically repeated every 15 seconds in search for new signals.

Scan

More information about generating and configuration formula-based alerts is presented in this tutorial: http://www.amibroker.com/guide/h_alerts.html

How to restore accidentially deleted price chart

When working with chart windows it sometimes may happen that we mistakenly close the chart we meant to keep displayed. Here are some suggestions showing how to quickly restore our working setup.

First situation happens when when we closed all chart windows and AmiBroker shows just an empty application window, what looks like this:

Empty chart space

In such situation the best way is to use File–>New–>Default Chart menu command, as a result will display a new chart window, which contains charts stored in default template.

Re-open default chart

Second situation is when we closed just the Price chart pane, so only indicators would remain in the chart window, looking like this:

No price pane

In order to bring the Price chart back, go to Charts window, unfold Basic Charts folder and double-click on Price (all in one) (if you want to get price chart with moving average and Bollinger bands overlays), or double-click Price (if you want to get price chart alone).

Insert price chart

It will be located at the bottom, below the other charts, but we can move it up to the top if we right-click on the chart, then choose Pane->Move Up from the context menu.

It is worth noting that AmiBroker allows to create multiple chart setups stored in Layouts, so if we have already created several layouts before, it is also possible to re-load one of the layouts from the Layouts window to restore the whole saved chart setup. This functionality is discussed in details in the following tutorial chapter: http://www.amibroker.com/guide/h_sheets.html

How to create your own code snippet

AmiBroker 5.84 (released today) offers users an easy way to create their own code snippets. Code snippet is a small piece of re-usable AFL code. AmiBroker comes with lots of pre-defined snippets. You can learn more about built-in snippets here.

But now you can add your own! And it is fairly easy using new Code Snippet window. Code Snippets window is available in new AFL editor (in floating frame mode). It can be shown/hidden using Window menu.

To create your own snippet, do the following:

  1. type the code you want
  2. select (mark) the code you want to place in a snippet
  3. press Save selection as snippet button in the Code Snippets window

Code Snippets 1

If you do the steps above the following dialog will appear:

Code Snippets 2

Now you need to enter the Name of the snippet, the Description and Category. Category can be selected from already existing items (using drop down box), or new category name can be typed in the category field. Key trigger field is optional and contains snippet auto-complete trigger (to be implemented later). Once you enter all fields and press OK, your new snippet will appear in the list.

Code Snippets 3

From then on you can use your own snippet the same way as existing snippets. Perhaps most convenient method is using drag-drop from the list to AFL editor.

As you may have noticed user-defined snippets are marked with red color box in the Code Snippets list. Only user-defined snippets can be overwritten and/or deleted. To overwrite existing user-defined snippet, simply follow the steps above and give existing name. AmiBroker will ask then if you want to overwrite existing snippet. To delete a snippet, select the snippet you want to delete from the list and press Delete (X) button in the Code Snippet window.

Why can’t I change the symbol? (Symbol lock)

If you can not change the active symbol for the chart, chances are that you have accidentally clicked “Symbol Lock” icon (a small padlock) located near the scroll bar.

Symbol Lock

When it is activated (yellow) then AmiBroker will prevent any symbol changes for active chart window. To toggle lock simply press the padlock icon.

« Previous PageNext Page »