How to work with Real-Time data plugins
One-time setup
In order to use AmiBroker with any real-time data source you have to set
up the database with appropriate data plug-in first. This is required only
once at the database creation time. Instructions for setting up are available
here: eSignal, myTrack, IQFeed, QuoteTracker.
Adding symbols
Now you can add symbols to your database. To do so please go to Symbol->New menu.
In the add symbol dialog enter one or more tickers (comma separated) you wish
to add to your database. If you want to see the chart for newly added symbol
just select it from the Symbol tree in the workspace window. Please allow few
seconds (depending on the speed of your internet connection) to backfill historical
data.
You may add more tickers that your RT account allows. AmiBroker
will automatically switch/update/refresh symbols so the most recently used
symbols are active and older ones are automatically removed from Data manager.
Doing so however may lead to some problems if you exceed your subscription
limits too much. So it is advised to use this feature responsibly and not expecting
getting 500 symbols while your subscription is limited to only 50.
Note that the above mechanism does not apply to real time quote window and
it can not hold more symbols than your subscription limit.
Showing real time quote window
|
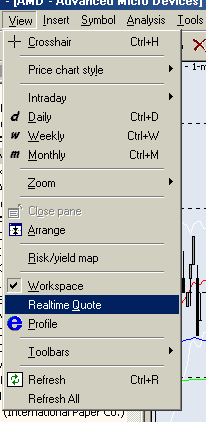
AmiBroker RT features real-time watch window that allows
you to watch streaming quotes. To show this window choose Window->Realtime
Quote menu. (see image to the right ---->)
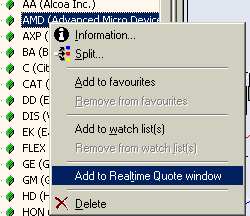
To add symbols to Realtime quote window you either double click on
the symbol tree or use right mouse button menu Add to Realtime quote
option as shown in the picture above.
|
 |
Working with real time quote window
The RT quote window provides real-time streaming quotes and some basic fundamental
data. It is fairly easy to operate as shown in the picture below:

You can also display context menu by pressing RIGHT mouse button over RT
quote window.
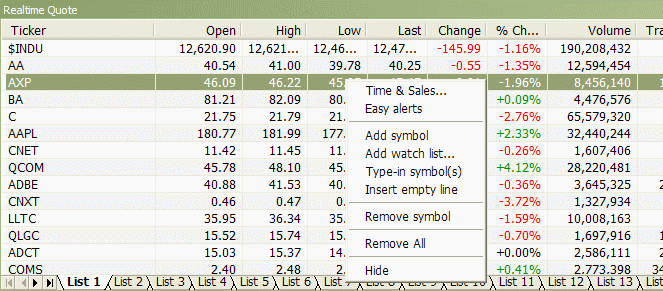
The context menu allows you to access the following options:
- Time & Sales
Opens Time & Sales window that provides
information about every bid, ask and trade streaming from the market.
- Easy Alerts
Opens Easy Alerts window that provides way
to define realtime alerts executed when bid/ask/last and other fields hit
user-defined levels
- Add Symbol
Adds current symbol to Real-Time Quote list
- Add watch list...
Adds entire watch list to real-time quote window
- Remove Symbol
Removes highlighted line (symbol) from the Real-Time Quote list.
- Remove All
Removes all symbols from real-time quote list
- Hide
Hides Real-Time Quote list
Bid/ask trend indicator

Version 5.90 adds Bid/Ask trend - a graphical indicator showing the direction
of 10 most recent changes in real-time bid/ask prices. The right-most box is
most recent and as new bid/ask quotes arrive they are shifted to the left side.
Color coding is as follows:
- Dark green: bid > previous
bid OR ask > previous ask
- Bright green: bid > previous
bid AND ask > previous ask
- Dark red: bid < previous
bid OR ask < previous ask
- Bright red: bid < previous
bid AND ask < previous ask
- Red / Green box: ask < previous
ask AND bid > previous bid
- Green / Red box: ask > previous
ask AND bid < previous bid
If bid/ask prices don't change there is no new box. NOTE: This column works
only if there are real-time quotes streaming (markets are open)
Working with intraday and daily charts
If your data source supports mixed EOD/Intraday mode (such as
eSignal or IQFeed) you can use single database for both types of charts.
However if your data source does not support mixed EOD/Intraday
mode and if you want to have long daily histories AND intraday charts you should
consider running
TWO
instances
of
AmiBroker.
One
for EOD
charts
and second for intraday charting. Both may use the same real-time data source.
Connection status display
The data plug-in connection status is displayed in the plugin
status display area located in the lower right part of the AmiBroker main
window as shown in the picture below. When connection status changes AmiBroker
plays
a beep sound and pops up bubble tool tip to inform about status change.
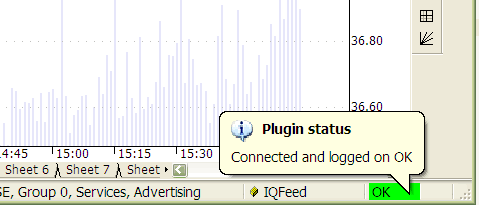
The bubble tip provides more detailed information text and
disappears automatically after 2 seconds.
If you want to re-display it just hover your mouse over plugin
status display area.
To enable quick examination of connection status AmiBroker displays
color coded information:
- OK (green light) means that connection is OK and indicates
correct operation of the plugin
- WAIT (yellow light) means that connection
is being set-up right now or the
plugin is connected only partially (to few of many servers). Usually this
state is transient and within few seconds the status comes back to "OK".
- ERR (red light) means that connection is broken. It may
mean invalid user name/password for your subscription, or the fact that some
3rd party component / program required is not running (for example if QuoteTracker
is not running and you are using QuoteTracker plugin). This state usually
requires some user intervention such as checking/fixing user/password in
File->Database Settings->Configure or running required component. When you
fix the reason the plugin will automatically attempt to reconnect (and
if reconnect is successfull then "OK" will be displayed)
- SHUT (purple light) means that some serious problem occurred
and the plugin will not attempt to reconnect automatically. In most cases
you have to first fix the problem that caused this state and then reconnect
manually using plugin context menu described below. Alternativelly you can
just restart AmiBroker.
Using plugin context menu
Real time plugins provide some additional controls via plugin
context menu. This context menu is available when you click with RIGHT mouse
button over plugin status display area. If you do, the menu like this will
be displayed:
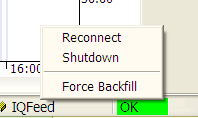
Please note that various plugins offer various options in this menu, however
most plugins provide at least 3 basic and useful options:
- Reconnect - this option allows you to reconnect manually.
Most RT plugins attempt to reconnect automatically, but sometimes manual
reconnect is necessary.
- Shutdown (Disconnect) - this allows to shutdown RT plugin.
This is useful when you want to stop streaming of quotes.
- Force backfill - this option causes that plugin re-downloads
entire (intraday) history from the server. Usually the plugin automatically
handles all backfills so you don't need to trigger backfills by hand. If
the plugin detects that you have some missing quotes from last available
bar till current date/time it triggers backfills and it is all automatic.
But... in at least two cases this option is useful:
- backfilling more bars after settings change (when you enlarge 'number
of bars to load' in File->Database Settings dialog you have to force
backfill for symbols that were backfilled previously with smaller number
of bars)
- cleaning up bad ticks (when you see a bad tick you may try forcing
backfill in hope that data vendor has cleaned up its database and you
will get fixed data - works well for eSignal that really appears to fix
bad ticks after they happen)
Things you should NOT do, or you should do very carefully
You should note the fact that when you are using data plugin then the plugin
controls the quotation database (see Understanding
database concepts article), therefore you should NOT import quotes from
ASCII files (this includes AmiQuote) for symbols that are already present in
the real-time database.
If you do, the plugin will eventually overwrite your imports with the real-time
data or your database will become corrupted (if you import end-of-day data
over intraday database).
So please do not import ASCII (especially EOD data) into real-time intraday
database fed by the plugin.
You may ask: why this is not disabled at all. The answer is that sometimes
it is useful and sometimes it will work (but these are rare cases). For example
it will work if you import INTRADAY data into the intraday database fed by
QuoteTracker plugin and both the database and imported data have exactly the
same bar interval.
It also works if you import the data for symbols that are
NOT present in the database. In this case newly imported symbols are marked
by ASCII importer as "use only local database for this symbol" (See Information
window for details), so they are EXCLUDED from the real-time update.
This is useful if you want to import some other data (even not quote data)
and access
it via Foreign function while using your real-time
database.
So ASCII import is not disabled in real-time database but you have to use
it with extreme care and know what you are doing.
Second thing is using Quote Editor. Although
data are controlled by the plugin it is in most cases possible to use Quote
Editor. However please note that you will be able to edit only 1-minute data
or higher interval, and you will be able only to edit symbols that are backfilled
completely (there is no running backfill for the particular symbol) and you
will NOT be able to edit last three bars. This is so because last three bars
are cached in the plugin. So you will be able to edit them only when new bars
arrive making them 'older' than last three.
'WAIT FOR BACKFILL' feature
The users of eSignal, myTrack and IQFeed real-time plugins may now
check "wait for backfill" box in the Automatic analysis window and
all scans, explorations and backfills will wait for completion of backfill
process for given symbol. This flag has no effect on databases that do not
use plugins (external data sources) or use end-of-day plugins (like FastTrack,
QP2, TC2000/TCNet, etc). This flag has also no effect when using QT plugin
due to the fact that QuoteTracker manages backfills by itself and does not
provide any control of backfill process to 3rd party applications.
BACKFILLING ALL SYMBOLS AT ONCE
To backfill all symbols at once in the data source that supports "Wait for
backfill" feature (IQFeed, eSignal), one can use Analysis window. The procedure
is as follows:
1. Open Formula Editor and type a simple single-line
rule like below and choose Tools->Send to Analysis
Buy = 1;
2. In the Analysis window select Apply to: *All symbols and Range:
1 recent bar

and turn on Wait for backfill option.
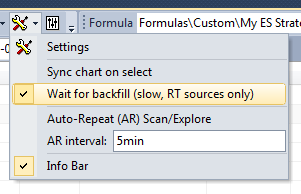
3. Press Scan button
The Analysis window will iterate through all symbols, requesting backfill
for each symbol and waiting until the data arrive, so at the end of the scan
all symbols
will be backfilled.


