February 2, 2015
High-Low of certain hours of the day
When we want to calculate high / low of selected hours of the trading session (e.g. first two trading hours), we can refer to TimeNum() function to identify timestamps of the bars. Then with use of HighestSince and ValueWhen functions we can obtain the high/low readings we need.
tn = TimeNum();

// define start/end hours in TimeNum format
StartTime = 93000;
Endtime = 113000;

// these conditions are true when TimeNum of the bar equals startime/endtime
StartBar = tn == StartTime;
EndBar = tn == Endtime;

// on the end bar we read the value of highest high or lowest low since the start bar
myH = ValueWhen( EndBar, HighestSince( StartBar, High ) );
myL = ValueWhen( EndBar, LowestSince( StartBar, Low ) );

// display price and high / low arrays
Plot( Close, "Close", colorDefault, styleBar|styleThick );
Plot( myH, "myH", colorGreen, styleThick );
Plot( myL, "myL", colorRed, styleThick );

// grey lines show how highest high / lowest low develop since start bar
Plot( HighestSince( StartBar, High ), "", colorgrey50 );
Plot( LowestSince( StartBar, Low ), "", colorgrey50 );

// area chart shows the zone we are reading our values from
Plot( tn >= StartTime AND tn <= Endtime, "",
      ColorBlend( colorYellow, colorWhite, 0.9 ),
      styleArea | styleOwnScale, 0, 1, 0, -1)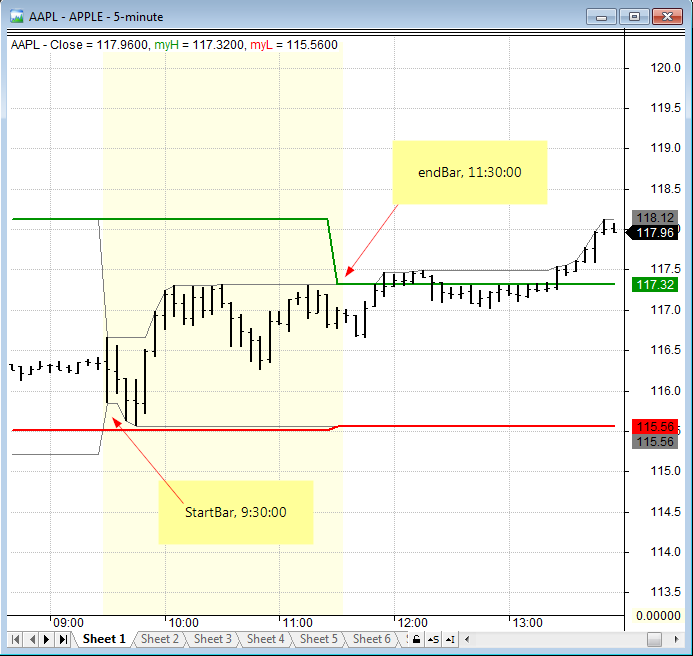
Now we can use myH and myL arrays in strategies that e.g. check for breakouts from the first two hours of trading session etc.
It is important to remember that the code checks for equality, so the timestamps used in our charts must exactly match the time we specify in the code. The timestamp settings can be defined in Tools->Preferences->Intraday. The approach presented above uses 1-minute data and timestamps showing Start Time of Interval
 Filed by Tomasz Janeczko at 4:32 pm under Indicators
Comments Off on High-Low of certain hours of the day