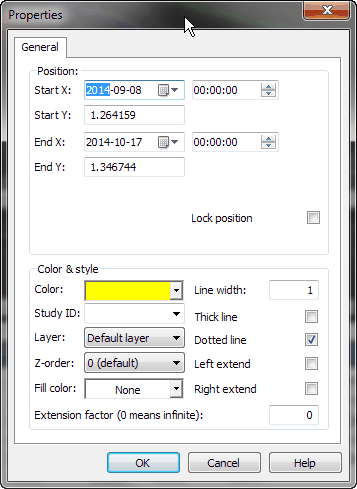
Line study properties window

In the study properites window you can select start and end coordinates as
well as line colours and styles. You can also enable automatic left- or right-
line extension so that line will be extended when new quotes will be available.
There are following fields available:
- Start X, Start Y, End X, End Y - study start and end coordinates
- Third X, Third Y - visible only for TRI-POINT studies
like triangle, pitchfork - the coordinates of 3rd control point of the
study
- Lock position - if this field is marked it's impossible to chenge
the position of the study with use of mouse
- Color - allows you to change the study color
- StudyID - defines Study ID which allows you to refer to the study
from AFL formula.
The detailed information is available in Using studies
in your AFL formulas chapter.
- Layer - indicates the layer that the study is placed on.
To learn more about layers read Working with layers.
- Z-order - defines the Z-order of the line. Lines, plots
and graphics can be ordered in "Z" direction using Z-order. Learn
more about this in Using Z-order tutorial.
- Line width - (new in 5.90) specifies line width in pixels.
Default line width is 1 pixel.
- Thick
- doubles the width of the line. The width is defined by Line
width parameter. Turning this on makes the line twice as wide, so
actual pixel width would be 2 * lineWidth.
- Left / Right Extend - you can choose whether line is extended
- Extension factor - (new in 5.90) - decides how far line
is extended to left/right. Lines are extended in the direction of "X-axis"
(i.e. date/time axis). 0 (zero) means infinite extension, one unit represents
X-axis distance between study end and start points. Fractional values are
allowed. Allowable range 0...25.5.
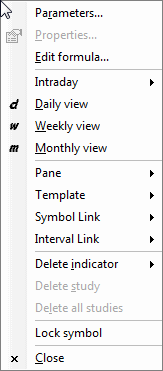
Line study properites window is accessible from chart window's right mouse
button menu. When you click on a study line with a right mouse button the following
menu appears:

Simply choose Properties to show the line study window.


