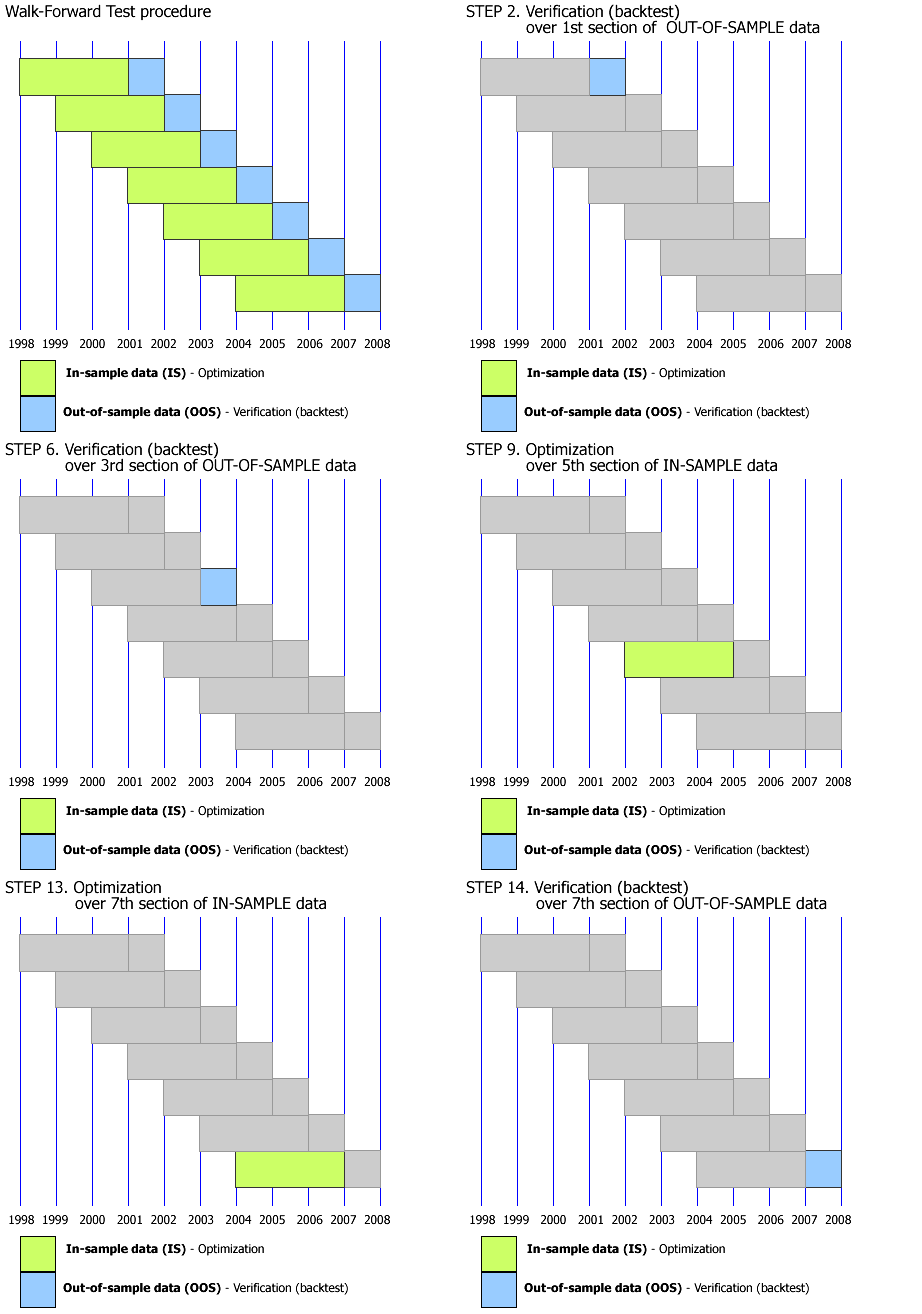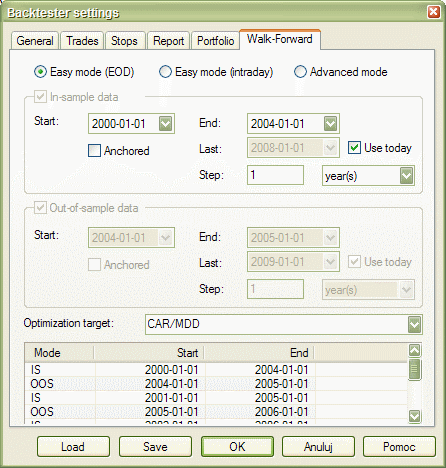
AmiBroker 5.10 features the automatic Walk-Forward test mode.
The automatic Walk forward test is a system design and validation technique in which you optimize the parameter values on a past segment of market data (”in-sample”), then verify the performance of the system by testing it forward in time on data following the optimization segment (”out-of-sample”). You evaluate the system based on how well it performs on the test data (”out-of-sample”), not the data it was optimized on. The process can be repeated over subsequent time segments. The following illustration shows how the process works.

The purpose of walk-forward test is to determine whenever the performance of optimized trading system is the realistic or the result of curve-fitting. The performance of the system can be considered realistic if it has predicitive value and performs good on unseen (out-of-sample) market data. When the system is properly designed, the real-time trading performance should be in relation to that uncovered during optimization. If the system is going to work in real trading, it must first pass a walk-forward test. In other words, we don't really care about in-sample results as they are (or should be) always good. What matters is out-of-sample system performance. It is the realistic estimate of how the system would work in real trading and will quickly reveal any curve-fitting issues. If out-of-sample performance is poor then you should not trade such a system.
The premise of performing several optimization/tests steps over time is that
the recent past is a better foundation for selecting system parameter values
than the distant past. We hope is that the parameter values chosen on the
optimization segment will be well suited to the market conditions that immediately
follow. This may or may not be the case as markets goes through bear/bull cycle,
so care should be taken when choosing the length of in-sample period. For more
information about system design and verification using walk-forward procedure
and all issues involved, we can recommend Howard Bandy's book: "Quantitative
Trading Systems" (see links on AmiBroker page).
To use Walk-Forward optimization please follow these steps:

IN-SAMPLE and OUT-OF-SAMPLE combined equity
Combined in-sample and out-sample equities are available by
~~~ISEQUITY and ~~~OSEQUITY composite tickers (consecutive periods of IS and
OOS are concatenated and scaled to
maintain continuity of equity line - this approach assumes that you generally
speaking are compounding profits).
To display IS and OOS equity you may use for example this:
PlotForeign("~~~ISEQUITY","In-Sample Equity", colorRed, styleLine);

PlotForeign("~~~OSEQUITY","Out-Of-Sample Equity", colorGreen, styleLine);

Title = "{{NAME}} - {{INTERVAL}} {{DATE}} {{VALUES}}";
OUT-OF-SAMPLE summary report (new in 5.60)
Version 5.60 brings a new walk-forward summary report that covers all out-of-sample
steps. It is visible in the
Report Explorer as last one and has "PS" type.
There were significant changes to walk forward testing made to allow summary
out-of-sample report.
The most important change is that each subsequent out-of-sample test uses initial
equity equal to previous step ending equity.
(Previously it used constant initial equity).
This change is required for proper calculation of all statistics/metrics throughout
all sections of out-of-sample test.
Summary report shows the note that built-in metrics correctly represent all
out-of-sample steps
but summary custom metrics are composed using user-definable method:
1 first step value, 2 last step value, 3 sum, 4 average, 5 minimum, 6 maximum.
By default summary report shows last step value of custom metrics UNLESS user
specifies different combining method in
bo.AddCustomMetrics() call.
bo.AddCustomMetrics has now new optional parameter - CombineMethod
bool AddCustomMetric( string Title, variant Value, [optional] variant LongOnlyValue, [optional] variant ShortOnlyValue , [optional] variant DecPlaces = 2, [optional] variant CombineMethod = 2 )
This method adds custom metric to the backtest report, backtest "summary" and optimization result list. Title is a name of the metric to be displayed in the report, Value is the value of the metric, optional arguments LongOnlyValue, ShortOnlyValue allow to provide values for additional long/short-only columns in the backtest report. Last argument DecPlaces controls how many decimal places should be used to display the value.
Supported CombineMethod values are:
1 first step value, - summary report will show the value of custom metric from
very first out-of-sample step
2 last step value (default), - summary report will show the value of custom
metric from the last out-of-sample step
3 sum, - summary report will show the sum of the values of custom metric from
all out of sample steps
4 average, - summary report will show the average of the values of custom metric
from all out of sample steps
5 minimum, - summary report will show the smallest value of custom metric from
all out of sample steps
6 maximum.- summary report will show the largest value of custom metric from
all out of sample steps
Note that certain metrics calculation methods are complex and for example
averaging them would not lead to mathematically correct representation of all
out of sample test.
Summaries of all built-in metrics are mathematically correct out-of-the-box
(i.e. they are *not* averages, but properly calculated metrics using method
that is appropriate for given value). This contrasts with custom metrics, because
they are user-definable and it is up to the user to select 'combining' method,
and still it may happen that none of the available methods is appropriate.
For that reason the report includes the note that explains what user-definable
method was used to combine custom metrics.