
or
or
or
or
New Analysis window introduced in version 5.50 (first time actually in 5.41.0 BETA) brings the following improvements over old Automatic Analysis:
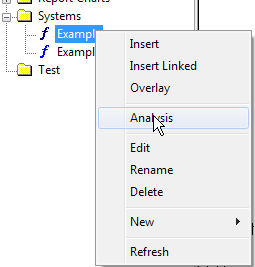
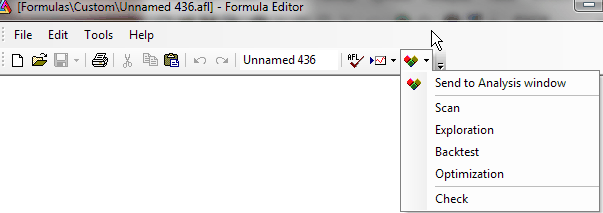
You can open New Analysis window in a number of ways:


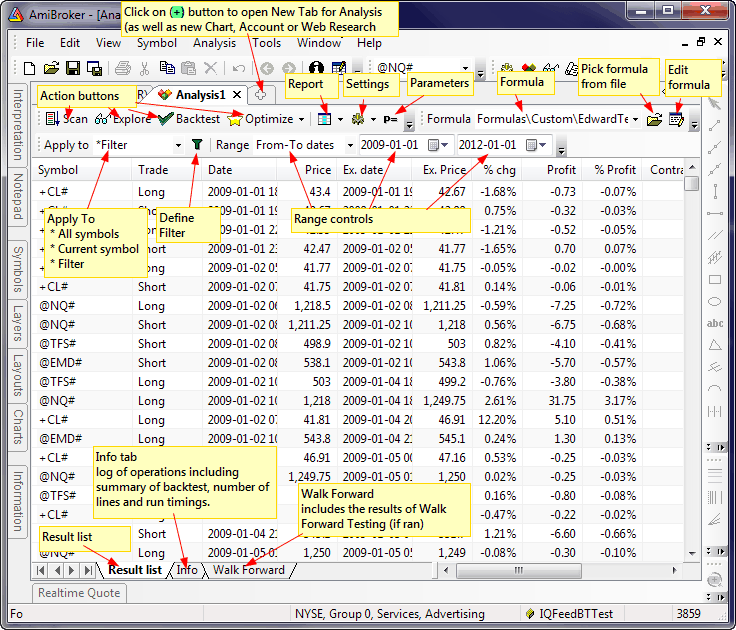
Basically the user interface for New Analysis window is functionally similar to old automatic analysis and looks as follows:
Basic operations
Selecting the symbol to apply analysis to.
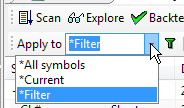
Click on the drop down arrow in
the Apply to combo to select
operation mode: All symbols / Current symbol / Filter
Defining Filter
If Apply To is set to Filter, Analysis window
will be run on the symbols that match filtering criteria that are definable
in the Filter Settings window. To open Filter Settings window press ![]() Filter button
Filter button
Defining date/time Range
Click on the drop down arrow in the Range combo to select range selection mode: All symbols / N recent bar(s) / N recent day(s) / From-To dates
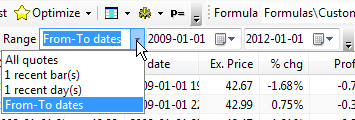
The 'N' can represent any number. For example to define range of 15 recent days, select 1 recent day(s) first and then type in 15 and press ENTER. You will see the text automatically update to 15 recent day(s). Remember you don't need to type whole thing, just a number is perfectly enough.
Viewing reports / Running Report Explorer
To view the report from last backtest, click on the Report button. To run the Report Explorer use a Report button drop down menu as shown below

Changing settings / options
To change backtester settings click on the Settings button. To turn on/off additional options like:
click on the drop down arrow on the Settings button to display the menu as shown below
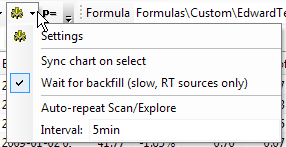
Auto-repeat interval can be entered in the Interval field. Note that plain numbers (like 5) represent minutes. To get seconds you need to enter 5sec or 5s and press ENTER
Running Walk forward Test
Click on the arrow on the Optimize button to display the menu as shown below and select Walk-Forward
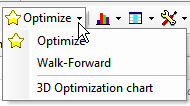
The results of Walk forward test will be displayed in Walk Forward tab (see bottom of Analysis window).
Displaying 3D optimization chart
To display 3D optimization chart, first run the Optimize that has exactly two optimization parameters and then click on the arrow on the Optimize button to display the menu as shown above and select 3D Optimization Chart.
Displaying Equity charts

Equity charts (portfolio and individual) can be added to chart windows using Portfolio Equity / Individual Equity options as shown above.
Exporting and importing result list
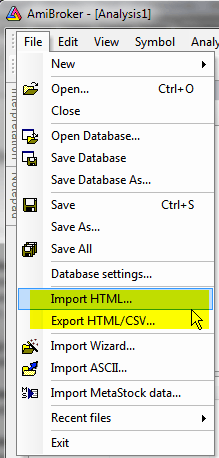
To export data to CSV file or HTML file use File -> Export HTML/CSV menu (from the main window). To import previously exported HTML file use File->Import HTML... as shown in the picture below. Note that these menu items appear only if you have New Analysis window active.
In addition to comprehensive batch capabilities AmiBroker 6.40 brings ability to run sequences of actions within Analysis window alone.
This new feature is not intended to replace batches but to augment available choices and allow "quick hacking" so you can run sequences directly in Analysis window without resorting to using full-fledged batches.
There is a new #pragma sequence(list of actions) statement that will define sequence of actions to be performed and a toolbar button "Run Sequence" to allow you to run sequence of actions via single click.
This allows you to say create composites and later run exploration that uses those composites all via single click on "Run Sequence" button
The code that uses #pragma sequence looks like this:
// the statement below defines sequence of actions

#pragma sequence(scan,explore)


if( Status("action")
== actionScan )

{


AddToComposite( .. );


StaticVarAdd(...);


_exit(); // quick exit in
scan mode

}


Filter = ...

AddColumn( ... ); // exploration
code that can use composites / static vars created in scan step